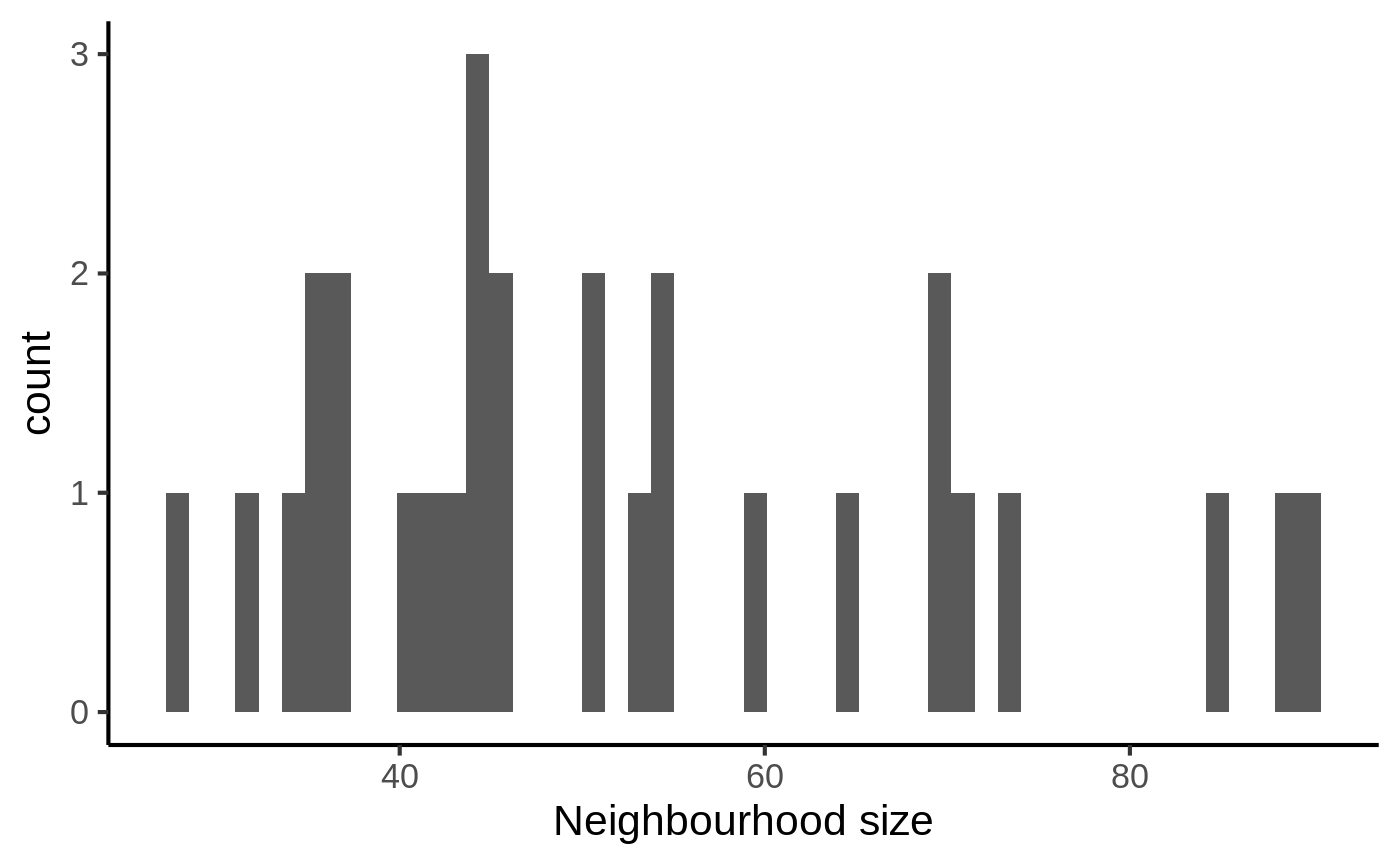
Plot histogram of neighbourhood sizes
plotNhoodSizeHist.RdThis function plots the histogram of the number of cells belonging to each neighbourhood
plotNhoodSizeHist(milo, bins = 50)
Arguments
| milo | A |
|---|---|
| bins | number of bins for |
Value
A ggplot-class object
Examples
require(igraph) require(SingleCellExperiment) ux.1 <- matrix(rpois(12000, 5), ncol=400) ux.2 <- matrix(rpois(12000, 4), ncol=400) ux <- rbind(ux.1, ux.2) vx <- log2(ux + 1) pca <- prcomp(t(vx)) sce <- SingleCellExperiment(assays=list(counts=ux, logcounts=vx), reducedDims=SimpleList(PCA=pca$x)) colnames(sce) <- paste0("Cell", 1:ncol(sce)) milo <- Milo(sce) milo <- buildGraph(milo, k=20, d=10, transposed=TRUE)#>#>plotNhoodSizeHist(milo)