RabbitGastrulation2022
View the Project on GitHub MarioniLab/RabbitGastrulation2022
Rabbit Development as a Model for Single Cell Comparative Genomics
Mai-Linh Ton1,2,* Daniel Keitley3,*, Bart Theeuwes2, Carolina Guibentif4, Jonas Ahnfelt-Rønne5, Thomas Kjærgaard Andreassen5, Fernando J. Calero Nieto2, Ivan Imaz-Rosshandler6, Blanca Pijuan-Sala7, Jennifer Nichols2, Èlia Benito-Gutiérrez3, John Marioni7,8,9, Berthold Göttgens1,2
Available on bioRxiv - https://doi.org/10.1101/2022.10.06.510971.
Table of Contents
Abstract
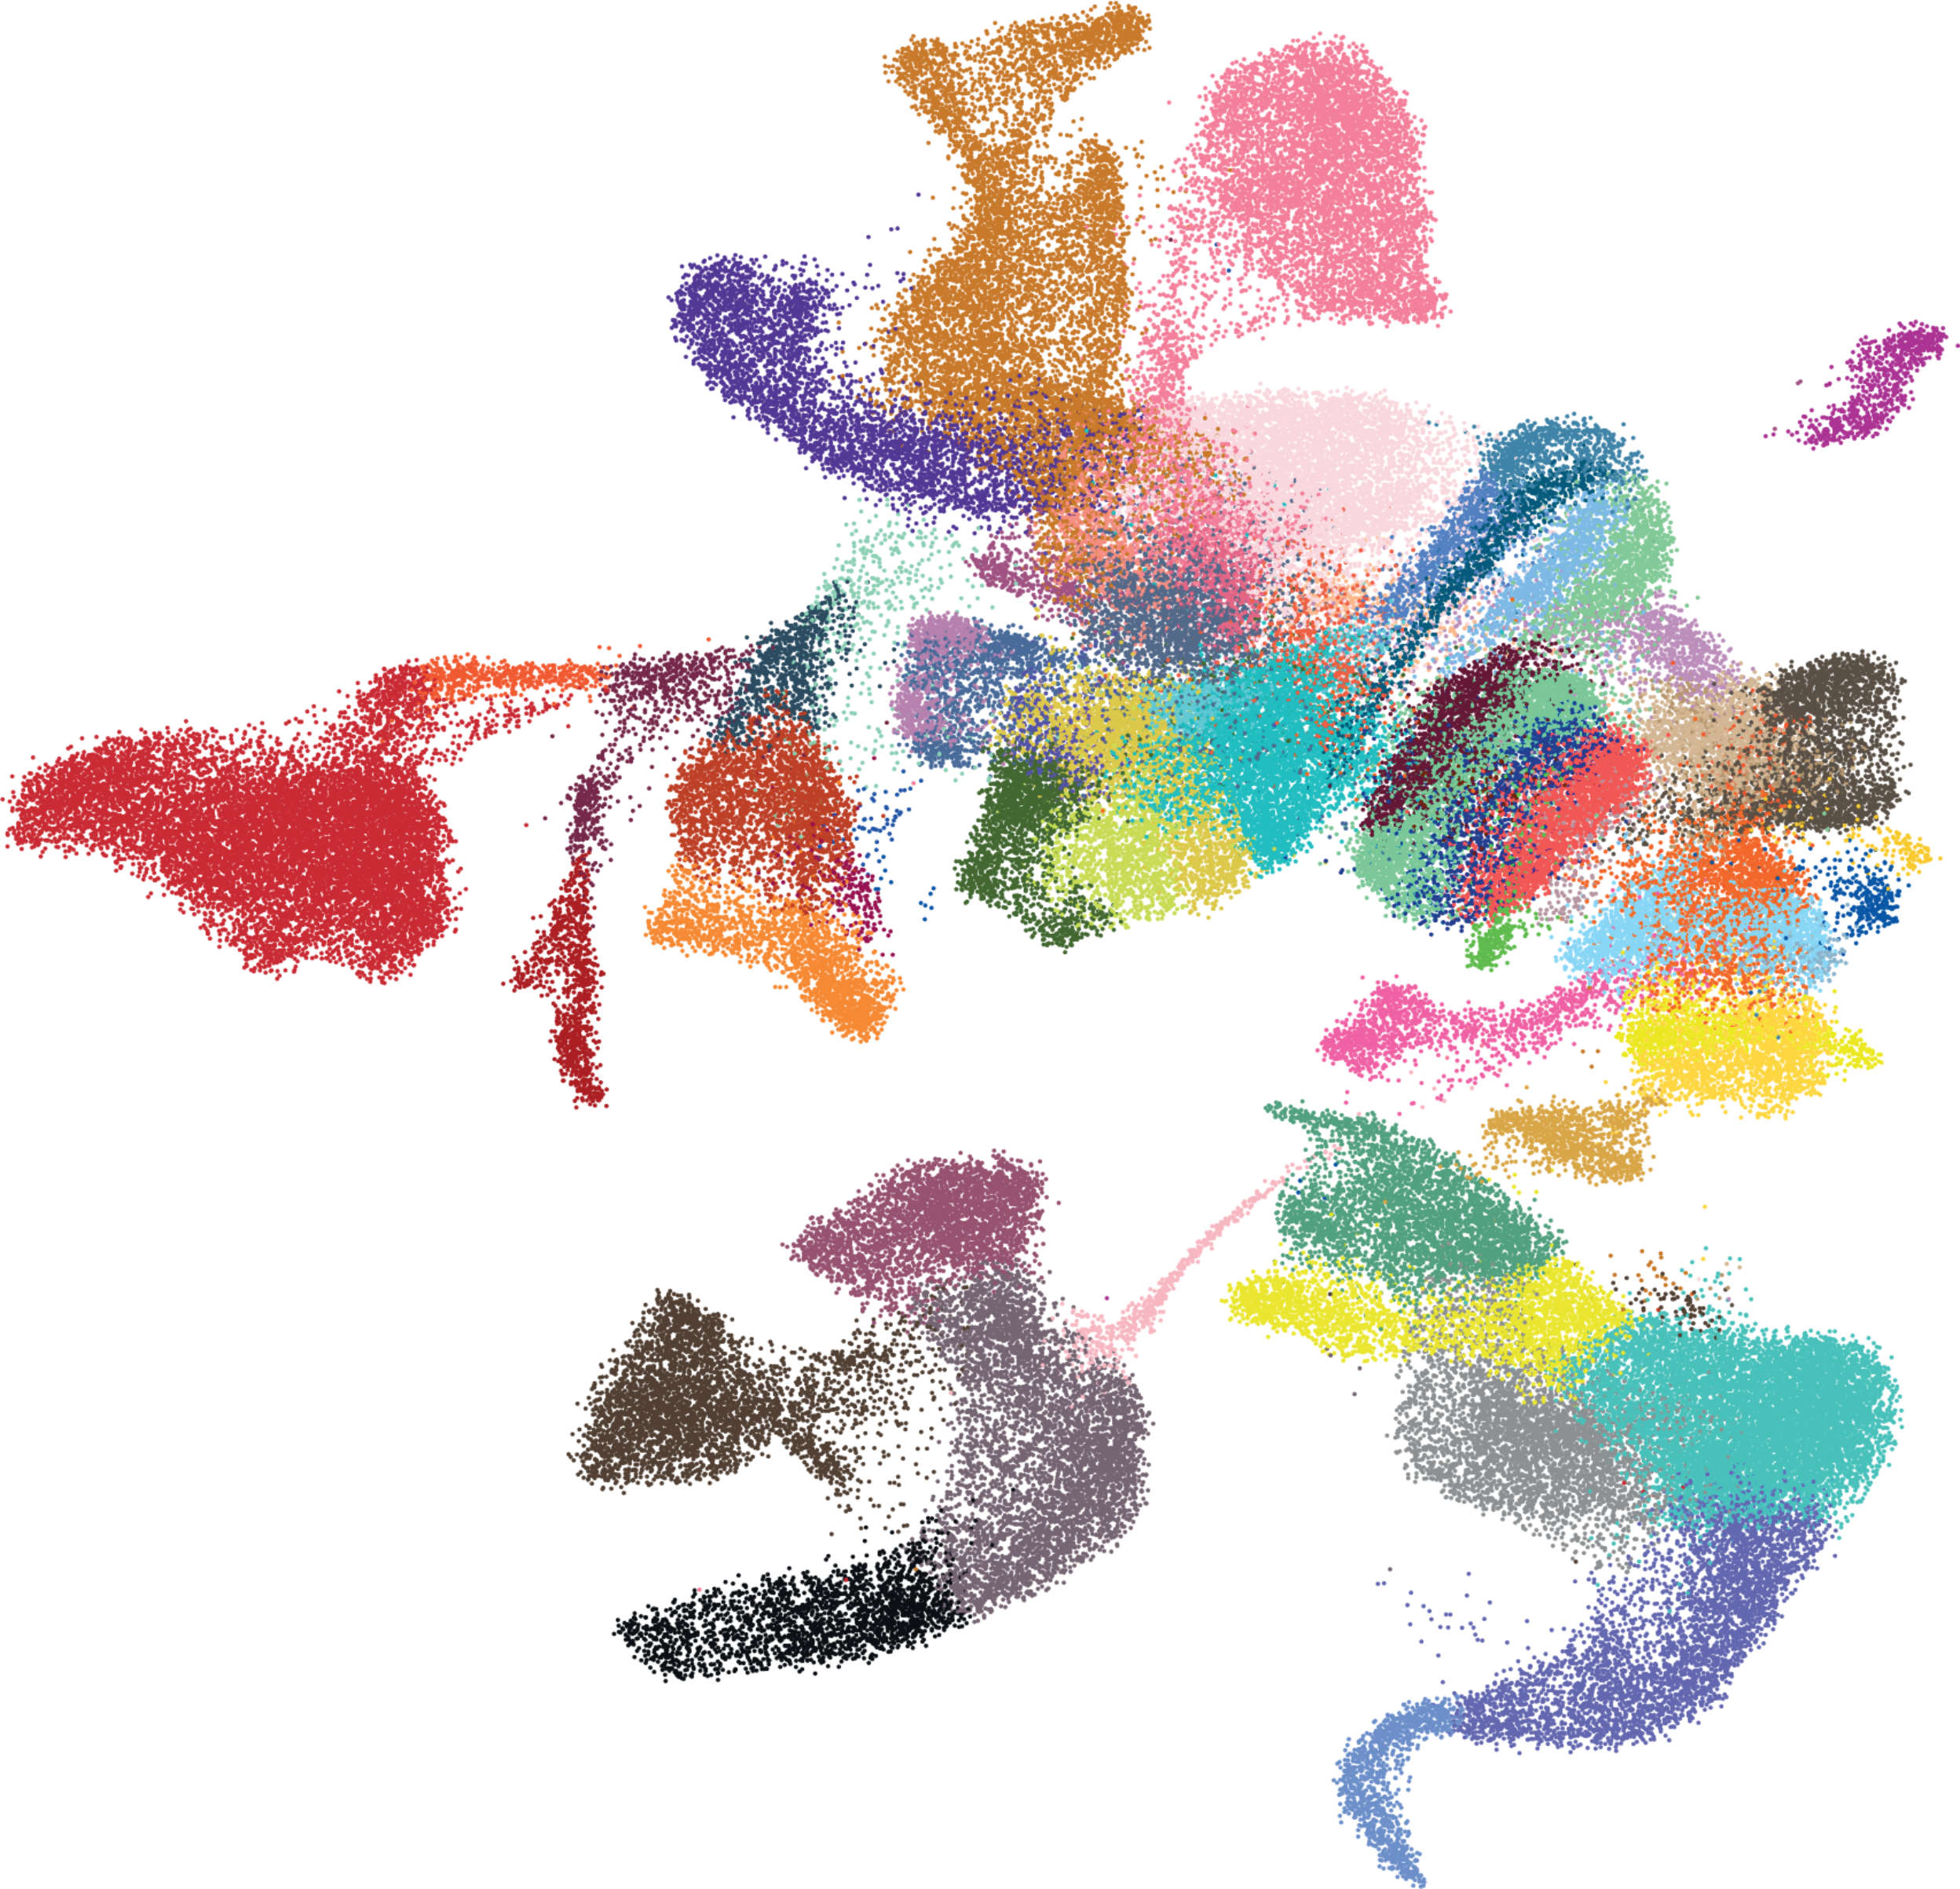
Biomedical research relies heavily on the use of model organisms to gain insight into human health and development. Traditionally, the mouse has been the favored vertebrate model, due to its experimental and genetic tractability. Non-rodent embryological studies however highlight that many aspects of early mouse development, including the egg-cylinder topology of the embryo and its method of implantation, diverge from other mammals, thus complicating inferences about human development. In this study, we constructed a morphological and molecular atlas of rabbit development, which like the human embryo, develops as a flat-bilaminar disc. We report transcriptional and chromatin accessibility profiles of almost 200,000 single cells and high-resolution histology sections from embryos spanning gastrulation, implantation, amniogenesis, and early organogenesis. Using a novel computational pipeline, we compare the transcriptional landscape of rabbit and mouse at the scale of the entire organism, revealing that extra-embryonic tissues, as well as gut and PGC cell types, are highly divergent between species. Focusing on these extra-embryonic tissues, which are highly accessible in the rabbit, we characterize the gene regulation underlying trophoblast differentiation and identify novel signaling interactions involving the yolk sac mesothelium during hematopoiesis. Finally, we demonstrate how the combination of both rabbit and mouse atlases can be leveraged to extract new biological insights from sparse macaque and human data. The datasets and analysis pipelines reported here will expedite the development of models of mammalian gastrulation and set a framework for a broader cross-species approach to decipher early mammalian development.
Data availability
RNA-seq data
Various forms of the transcriptomics data are available here for loading into R and python.
| File name | Description |
|---|---|
r_anndata.h5ad |
AnnData object for processing with scanpy. |
r_sce.rds |
Contains a SingleCellExperiment object for processing in R. |
r_counts.mtx |
Counts matrix in MatrixMarket format |
r_logcounts.mtx |
Normalised logcounts in MatrixMarket format |
r_meta.tsv |
Per-cell observations (e.g. sample, cell type annotation, stage) |
r_genes.tsv |
Ensembl codes and gene names for the scRNA-seq features. |
r_sizefactors.tsv |
Normalisation size factors computed for each cell using scran. |
r_corrected_pcs.tsv |
The top 50 principal components resulting from fastMNN batch correction. |
r_reducedDims.rds r_umap.tsv r_tsne.tsv r_fa.tsv r_umap3d.tsv |
List of DataFrames containing coordinates for reduced dimensionality representations (e.g. UMAP, TSNE, PCA). |
oc_mm_orthologs.tsv |
DataFrame of one-to-one orthologs between the rabbit (Oryctolagus cuniculus) and mouse (Mus musculus) obtained through Ensembl. |
oc_train_mf.rds oc_train_hs.rds mm_train_mf.rds mm_train_hs.rds |
SingleR models trained on rabbit (oc) and mouse (mm) datasets for predicting cell types in macaque (mf) and human (hs) data. |
Raw FASTQ files are available through ArrayExpress under accession E-MTAB-11836.
ATAC-seq data
Fragment files for each of the samples can be found here.
Raw FASTQ files for the ATAC-seq data is available through ArrayExpress under accession E-MTAB-11804.
Other
The modified genome annotation (GTF) file used to process the RNA-seq data has been deposited here. The original OryCun 2.0 reference and extended 3’ annotations are also provided.
For details of the other, externally generated datasets used in our analysis, see the methods section of the paper.
Histology/RNAscope images
See the paper methods (under ‘Histology’ and ‘RNAscope’) for more details of how the imaging was performed.
Due to the very large volume and size of the imaging data, we have provided several different methods to access the datasets depending on the resolution and type of image analysis required. For quick browsing of large numbers of images, we recommend downloading the low-resolution thumbnail images. To zoom in/out and interactively view a limited set of high-resolution images, we recommend using the Shiny app. To view specific sections at the highest resolution, we recommend downloading the raw Olympus files through the EBI BioImage Archive. See more info below.
The directories containing each imaging dataset are named according to the following format:
{Stage}_{Embryo_ID}_{Plane}_{Histology/RNAscope}_{Probes}.
| Directory name | Stage | Embryo ID | Imaging plane | Image type | Probes |
|---|---|---|---|---|---|
| GD7_1909-19_Transverse_HE | GD7 | 1909-19 | Transverse | Histology | - |
| GD7_1909-19_Transverse_RNAscope_TFAP2C-POU5F1-NANOS3 | GD7 | 1909-19 | Transverse | RNAscope | TFAP2C, POU5F1, NANOS3 |
| GD7_6901-19_Sagittal_RNAscope_TFAP2C-POU5F1-NANOS3 | GD7 | 6901-19 | Sagittal | RNAscope | TFAP2C, POU5F1, NANOS3 |
| GD7_6902-19_Sagittal_HE | GD7 | 6902-19 | Sagittal | Histology | - |
| GD7_6902-19_Sagittal_RNAscope_POU5F1-CDH1 | GD7 | 6902-19 | Sagittal | RNAscope | - |
| GD7_6902-19_Sagittal_RNAscope_TFAP2C-POU5F1-NANOS3 | GD7 | 6902-19 | Sagittal | RNAscope | TFAP2C, POU5F1, NANOS3 |
| GD7_6904-19_Transverse_HE | GD7 | 6904-19 | Transverse | Histology | - |
| GD8_6981-18_Sagittal_RNAscope_TFAP2C-POU5F1-NANOS3 | GD8 | 6981-18 | Sagittal | RNAscope | TFAP2C, POU5F1, NANOS3 |
| GD8_6983-18_Transverse_HE | GD8 | 6983-18 | Transverse | Histology | - |
| GD8_7340-19_Transverse_HE | GD8 | 7340-19 | Transverse | Histology | - |
| GD8_7347-19_Transverse_HE | GD8 | 7347-19 | Transverse | Histology | - |
| GD8_7350-19_Transverse_HE | GD8 | 7350-19 | Transverse | Histology | - |
| GD8_7350-19_Transverse_RNAscope_TFAP2C-POU5F1-NANOS3 | GD8 | 7350-19 | Transverse | RNAscope | TFAP2C, POU5F1, NANOS3 |
| GD9_1034-19_Coronal_HE | GD9 | 1034-19 | Coronal | Histology | - |
| GD9_1034-19_Coronal_RNAscope_CDH5-RUNX1-AHNAK | GD9 | 1034-19 | Coronal | RNAscope | CDH5, RUNX1, AHNAK |
| GD9_7029-18_Sagittal_HE | GD9 | 7029-18 | Sagittal | Histology | - |
| GD9_7029-18_Sagittal_RNAscope_LGALS2-DKK1-SEPRINC1 | GD9 | 7029-18 | Sagittal | RNAscope | LGALS2, DKK1, SERPINC1 |
| GD9_7029-18_Sagittal_RNAscope_TFAP2C-POU5F1-NANOS3 | GD9 | 7029-18 | Sagittal | RNAscope | TFAP2C, POU5F1, NANOS3 |
| GD9_7092-18_Sagittal_RNAscope_CDH5-RUNX1-AHNAK | GD9 | 7092-18 | Sagittal | RNAscope | CDH5, RUNX1, AHNAK |
| GD9_7092-18_Sagittal_RNAscope_DAPB-Control | GD9 | 7092-18 | Sagittal | RNAscope | DAPB |
Thumbnail images
The easiest/quicket way to view the entire imaging dataset is to download the set of thumbnail images accessible here. These are low-resolution .png snapshots of each section and are labelled consistently with the raw Olympus files available on the EBI BioImage Archive (see below). This makes it straightforward to scan through all the images and locate raw, high-resolution copies for particular sections of interest.
Specifically, within each directory, the filenames relate to the slide (slXXX) and series (series_XX) contained within the source .vsi file.
For example:
| Thumbnail image | Source file |
|---|---|
| 21238-937_Sl030_7340-19_Rabbit_Foetus_sl001_HE_02_series_16.png | 21238-937_Sl030_7340-19_Rabbit_Foetus_sl001_HE_02.vsi |
Raw Olympus files
The raw imaging files have been uploaded to the EBI BioImage Archive under accession S-BIAD604. These files are in the Olympus vsi/ets format and can be viewed using Fiji/ImageJ. Each .vsi file contains multiple sections at various resolutions.
View images interactively
A representative sample of images from each dataset can be easily viewed through the Shiny app available at https://crukci.shinyapps.io/scrabbit-shiny/.
To interactively view images not available in our representative set, the raw Olympus files can be converted to an OME-TIFF format using bioformats2raw and raw2ometiff. We recommend first opening the relevant .vsi image in FIJI, and exporting the specific section and resolution of interest to a .tif file. This can then be converted using bioformats2raw and raw2ometiff. More detailed instructions can be found here. OME-TIF files created can be viewed using the Aviator visualisation tool available at https://avivator.gehlenborglab.org/. To reduce latencies and improve loading times, it is also recommended to create a json offsets file for the OME-TIF. This can be achieved using the generate_tiff_offsets tool.
e.g.
# Convert .tif to raw format
bioformats2raw --compression=zlib -p INPUT.tif RAW_OUTPUT/
# Convert raw to ome-tiff
raw2ometiff --compression=LZW -p RAW_OUTPUT/ OUTPUT.ome.tif
# Create offsets file
generate_tiff_offsets --input_file OUTPUT.ome.tif
Explore the data
Shiny app / Vitessce
You can interactively explore our single-cell transcriptomics and imaging data on the the web via our shiny app accessible at https://crukci.shinyapps.io/scrabbit-shiny/.
cellxgene
The transcriptomics data can also be explored locally using cellxgene. After following the cellxgene installation instructions, the rabbit data can be loaded via the anndata .h5ad file stored in the link above.
cellxgene launch https://content.cruk.cam.ac.uk/jmlab/RabbitGastrulation2022/data/r_anndata.h5ad --max-category-items 100
Note: Launching cellxgene with a local copy of the r_anndata.h5ad file may result in faster loading times.
Code availability
The code used to process and analyse and the rabbit transcriptomics data is available through the RabbitGastrulation2022 github repository.
The code is organised into R and python Jupyter notebooks. Many of the functions used are packaged into the scrabbitr and scrabbitpy packages. See the individual github repositories for installation instructions.
Support or Contact
General queries can be directed to Bertie Göttgens , John Marioni or Èlia Benito-Gutiérrez. For issues relating to the data, code or shiny app, you can file an issue on the most relevant github repository or email Daniel Keitley at dk562@cam.ac.uk.
Other links
Affiliations
-
Department of Haematology, University of Cambridge, Cambridge, UK
-
Wellcome-Medical Research Council Cambridge Stem Cell Institute, University of Cambridge, Cambridge, UK
-
Department of Zoology, University of Cambridge, Cambridge, UK
-
Department of Microbiology and Immunology, University of Gothenburg, Gothenburg, Sweden
-
Department of Pathology & Imaging, Novo Nordisk, Måløv, Denmark
-
Medical Research Council Laboratory of Molecular Biology, Cambridge, UK
-
Genome Biology Unit, European Molecular Biology Laboratory (EMBL), Heidelberg, Germany
-
Wellcome Sanger Institute, Wellcome Genome Campus, Cambridge, UK
-
European Molecular Biology Laboratory European Bioinformatics Institute, Cambridge, UK
-
Cancer Research UK Cambridge Institute, University of Cambridge Cambridge, UK
* Authors contributed equally