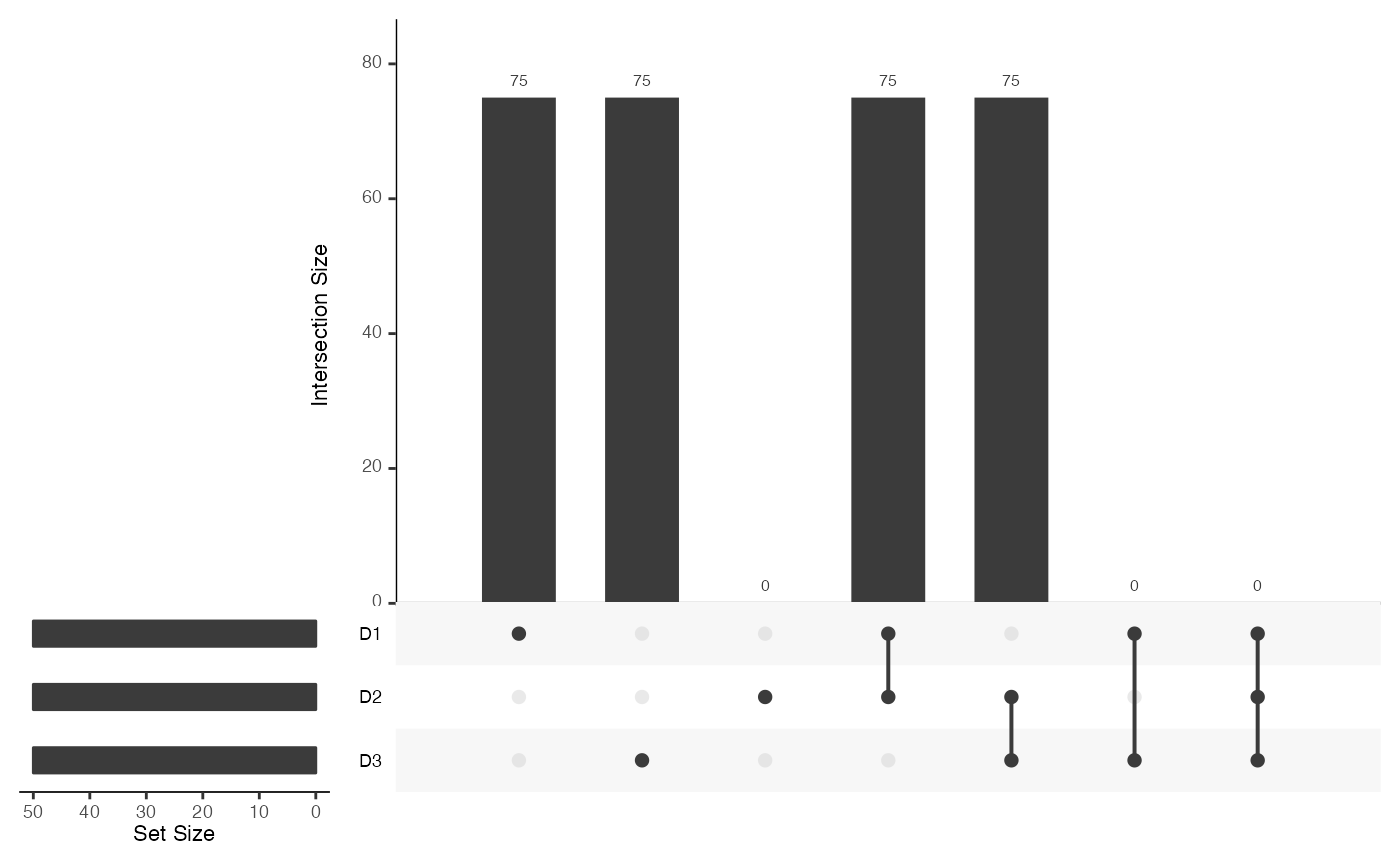
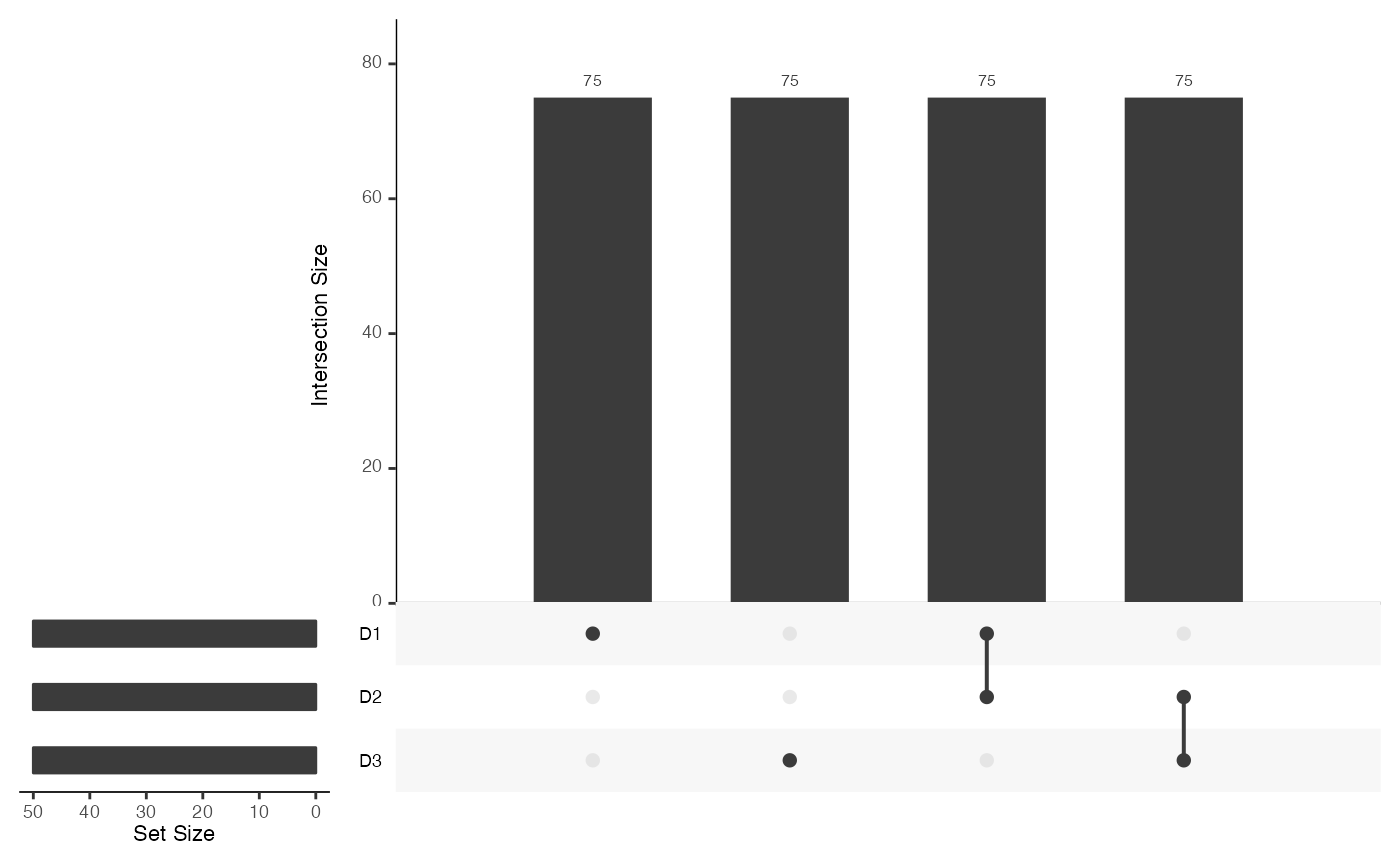
Plots feature overlaps of mosaic data as an UpSet plot.
mosaicDataUpSet(assay_list, plot = FALSE, ...)Arguments
- assay_list
a list of data matrices with rownames (features) specified.
- plot
logical (default FALSE) whether the UpSet plot should be printed.
- ...
further arguments passed to `upset` from the `UpSetR` package.
Value
UpSet object displaying degree of overlap of rownames (features)
among each of the data matrices in assay_list. Set bars correspond to
the number of cells/samples present in each data matrix.
Examples
set.seed(2021)
assay_list = mockMosaicData()
lapply(assay_list, dim)
#> $D1
#> [1] 150  50
#>
#> $D2
#> [1] 150  50
#>
#> $D3
#> [1] 150  50
#>
mosaicDataUpSet(assay_list)


# additional arguments from UpSetR::upset()
mosaicDataUpSet(assay_list, empty.intersections = TRUE)
# additional arguments from UpSetR::upset()
mosaicDataUpSet(assay_list, empty.intersections = TRUE)